

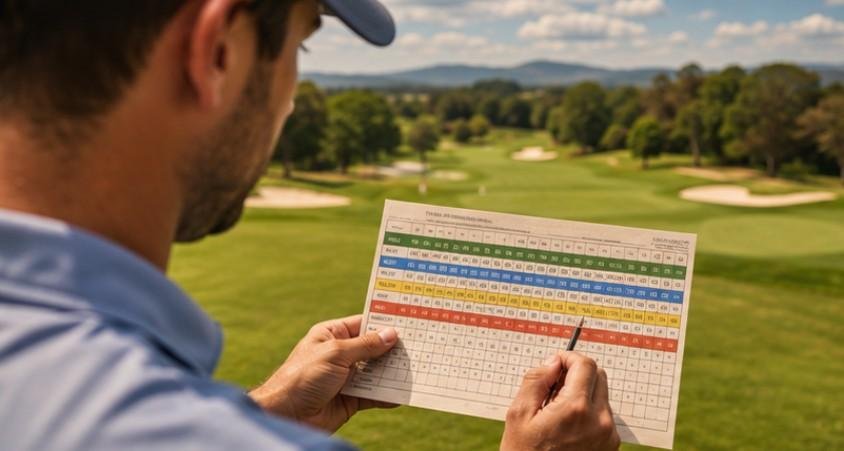
A golf scorecard is not just a slip of paper for tallying strokes; it is a dense, two-dimensional spatial map that compresses a 150-acre terrain into an elegant metadata grid.
To an untrained eye, it looks like an overwhelming matrix of numbers, colors, and abbreviations. But for photographers, cinematographers, and visual thinkers accustomed to reading exposure charts or focal maps, a golf card is simply spatial data waiting to be decoded. Learning how to read a golf scorecard transforms a confusing grid into a clear tactical blueprint of the course.
The Spatial Architecture of a Golf Scorecard
When you look at a scorecard, you are looking at an elevation and distance breakdown of 18 distinct spatial challenges. Understanding this layout is essential for visualizing how a course is engineered.
| FRONT NINE (OUT) | BACK NINE (IN) |
|---|---|
| Holes 1–9 | Holes 10–18 |
| Leads away from the clubhouse | Returns toward the clubhouse |
| ↓ | ↓ |
| TOTAL SCORECARD | TOTAL SCORECARD |
The Out and In Framework
Golf scorecards are split into two halves. Holes 1 through 9 are designated as OUT, while holes 10 through 18 are designated as IN. This terminology dates back to traditional links courses in Scotland, such as Old Course at St Andrews, where players hit tee shots outbound away from the clubhouse for nine holes and turned back inland for the final nine.
Tee Colors and Distance Vectors
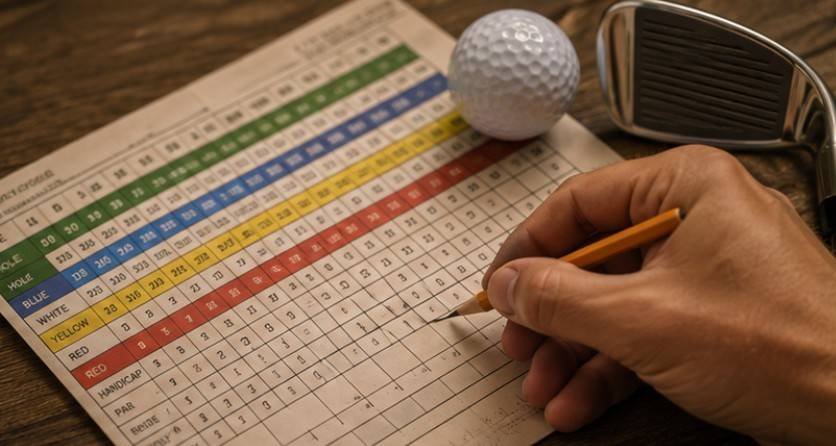
Rows of color-coded boxes represent different starting locations on each hole:
- Black/Gold: Professional or championship tees (maximum distance).
- Blue: Low-handicap or advanced tees.
- White: Intermediate or standard men’s amateur tees.
- Red/Green: Forward or ladies’/juniors’ tees.
Each row displays the precise yardage from that tee box to the center of the green. For visual creators who calculate focal length and depth of field, yardage numbers function like distance scales on a camera lens.
Par and Target Metrics
Par represents the baseline target number of strokes an expert golfer should require to complete a hole. Most individual holes carry a par value of 3, 4, or 5:
- Par 3: Short distance (usually under 225 yards), reachable in one shot.
- Par 4: Medium distance (300–470 yards), requiring a tee shot and an approach shot.
- Par 5: Long distance (470+ yards), typically requiring three strategic shots to reach the green.
A standard 18-hole course generally carries a total par of 72.
Decoding the Data: Handicaps, Strokes, and Visual Symbols
Beyond yardage and par, a scorecard incorporates advanced statistical ratings designed to level the playing field between players of varying skill levels.
The Handicap (HCP) Index
The line labeled Handicap or Stroke Index (SI) ranks the relative difficulty of each hole on a scale from 1 to 18.
- Hole Handicap 1: Mathematically rated as the toughest, most complex hole on the course.
- Hole Handicap 18: Rated as the easiest hole on the course.
In match play or net scoring, players use the handicap row to determine where they receive extra baseline shots based on their official player rating.
Key Golf Terms and Scoring Rules
Your total stroke count relative to par determines your shorthand score on each hole:
| Term | Meaning Relative to Par | Score Example on Par 4 |
| Eagle | 2 strokes under par | 2 |
| Birdie | 1 stroke under par | 3 |
| Par | Equal to par | 4 |
| Bogey | 1 stroke over par | 5 |
| Double Bogey | 2 strokes over par | 6 |
| Triple Bogey | 3 strokes over par | 7 |
Editor’s Note: A line chart comparing hole distance versus player scoring average across various handicap levels can help visualize how hole difficulty scales.
Scorecard Notation Symbols
When reviewing printed tournament scorecards or television broadcasts, you will notice geometric symbols drawn around the numbers:
- Circle: Represents a Birdie.
- Double Circle: Represents an Eagle or better.
- Square: Represents a Bogey.
- Double Square: Represents a Double Bogey or worse.
These visual markers allow players to scan a completed card instantly and evaluate performance metrics without manually recalculating every row.
Why Scorecard Data Matters Beyond the Fairway
Understanding golf metrics like provisional ball rule in golf,offers fascinating applications in field engineering, data visualization, and camera placement. Broadcast crews relies on these numbers to plan broadcast angles, lens choices, and drone flight paths.
When a network visualizes a hole for broadcast, directors cross-reference the yardage row with terrain elevation charts from the U.S. Geological Survey (USGS) to map line-of-sight obstacles. Camera operators shooting high-speed sports motion evaluate hole handicap numbers to anticipate where players are likely to make high-risk errors. This helps them position tracking lenses for dramatic recover shots.
Furthermore, academic research on athletic performance published through Purdue University highlights how data tracking directly impacts decision-making under physical pressure. Treating a golf card like a structured dataset helps athletes eliminate emotional bias during competition.
For organizations dedicated to outdoor preservation like the National Park Service and environmental planning groups like the Audubon International program, scorecard mapping provides a baseline for tracking land utilization and habitat conservation across suburban green belts.
Step-by-Step: How to Keep Score on the Course
[Step 1: Gross Score] ──> Write exact strokes taken (e.g., 5).
│
▼
[Step 2: Half Totals] ──> Sum Holes 1–9 (OUT) & 10–18 (IN).
│
▼
[Step 3: Combine] ──> Add OUT + IN for Total Gross Score.
│
▼
[Step 4: Net Adjust] ──> Subtract Course Handicap for Net Score.
Keeping an accurate record requires a methodical process:
- Record Gross Strokes: At the end of each hole, write down the raw number of physical strokes taken, including penalty strokes for lost balls or water hazards.
- Calculate the Front Nine (OUT): Sum your raw scores for holes 1 through 9.
- Calculate the Back Nine (IN): Sum your raw scores for holes 10 through 18.
- Determine the Total Gross Score: Add your OUT and IN totals together.
- Apply Handicap Adjustments: To find your Net Score, calculate your official rating via the United States Golf Association (USGA) handicap system and subtract those allocated strokes from your Total Gross Score.
Limitations and Exceptions to Standard Scorecard Reading
While standard scorecards follow a uniform layout, specialized game formats alter how you read the data:

- Stableford Format: Rather than counting total strokes, points are awarded based on the score achieved on each hole relative to par (e.g., 2 points for par, 3 for birdie). Higher total points win.
- Match Play: Stroke totals are secondary; players compete hole-by-hole. The card tracks who is “Up” or “Down” across 18 holes.
- Adjusted Maximum Scores: Under Net Double Bogey rules, players cap their maximum score on any single hole for handicap tracking purposes, preventing one disastrous hole from ruining a full dataset.
Frequently Asked Questions
1. How to read a golf scorecard for beginners?
Look at the hole number, check the par rating for target strokes, and match your tee color to find the yardage. Record your raw strokes for each hole, sum holes 1–9 (OUT) and 10–18 (IN), then add both totals.
2. What score would a 20 handicap shoot?
A player with a 20 handicap typically shoots around 92 on a standard par-72 course. This reflects an average performance of roughly 20 strokes over par across 18 holes.
3. How to interpret a golf score?
Compare your total strokes to the total course par. A score equal to par is 72, scores below 72 are under par (better), and scores above 72 are over par. Net scores factor in player handicap.
4. What do the symbols mean on a golf scorecard?
Circles indicate scores below par (one circle for birdie, two for eagle). Squares indicate scores above par (one square for bogey, two for double bogey). Numbers with no symbol represent par.
Learning to read a golf scorecard bridges the gap between raw numbers and tactical strategy. By treating the card as a structured grid of spatial data, distance vectors, and difficulty ratings, you gain an immediate appreciation for course design and athletic performance. Whether you are aiming a camera lens down a narrow fairway or stepping up to the tee box yourself, decoding these metrics turns a simple game into a clearly mapped spatial discipline.